Summary of ASPERA-3 observations from Mars Commissioning and onward. Note that the page can take quite a while to load. Each line corresponds to an orbit. Orbits are grouped together in sessions according to the time interval when Aspera was on, as indicated by background color. E.g., orbit 68 was a single orbit session, while orbit 358-360 was a three orbit session. For each sensor the mode and time interval is presented, e.g., H[20,200] means high mode from 20 to 200 minutes. All times are in minutes relative pericenter. A=Apocenter. The modes are L=Low, N=Normal, H=High and B=Burst. Note that observation times can include switch-on and HV ramping, so the period with science data might be shorter. The Comments-link gives a complete command timeline for the session. The File column are links to the raw TM (.sfduZ) files for the session, stored at http://aspera-3.irf.se/data/ An empty File-field for a session means that data is not available yet. More operation related information can be found at http://aspera-3.irf.se/
| Orbit | DOY | Pericenter Time | IMA | ELS | NPI | NPD | Comments | File |
|---|---|---|---|---|---|---|---|---|
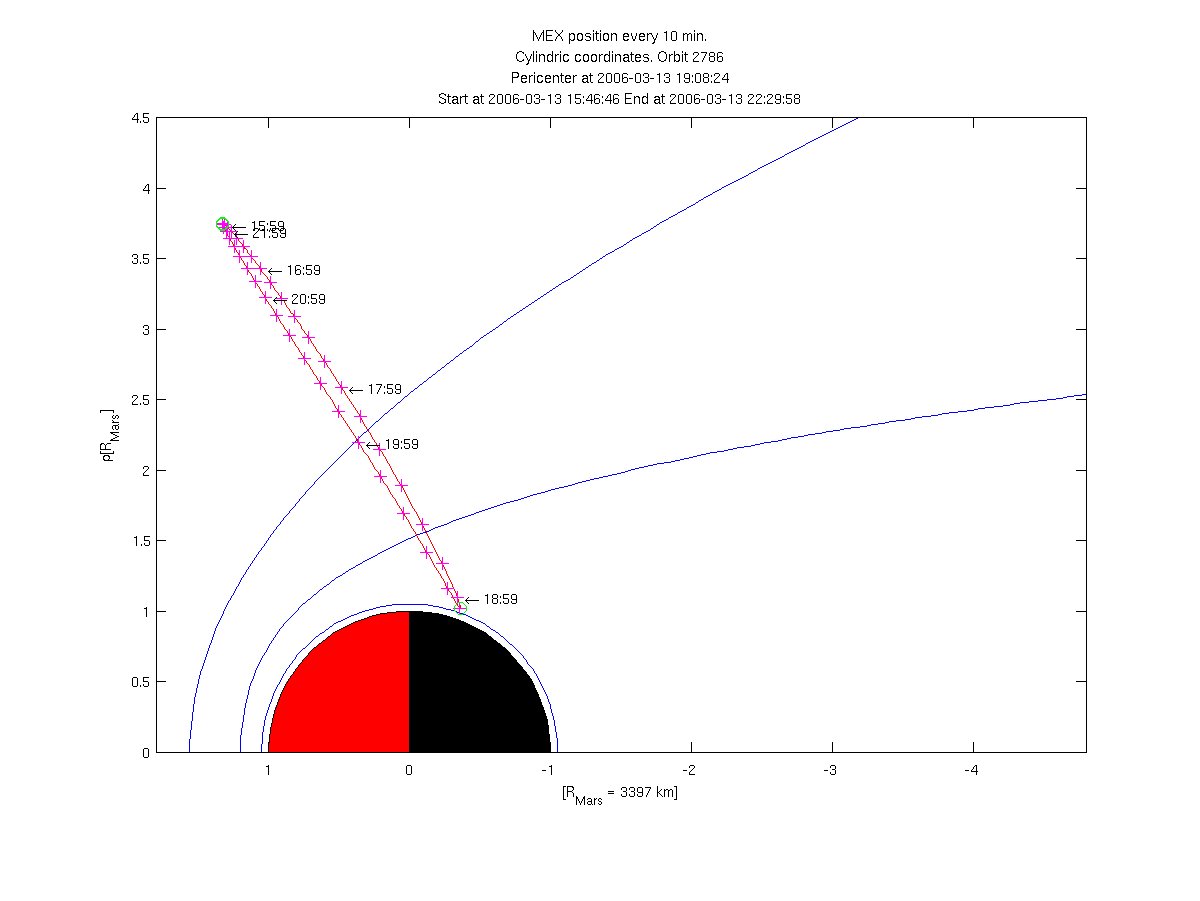
| 2786 | 072 | 2006-03-13 19:08:24 | _ | |||||
| 2786 | 072 | 2006-03-13 19:08:24 | _ | |||||
| 2787 | 073 | 2006-03-14 01:51:34 | _ | |||||
| 2787 | 073 | 2006-03-14 01:51:34 | _ | |||||
| 2787 | 073 | 2006-03-14 01:51:34 | _ | |||||
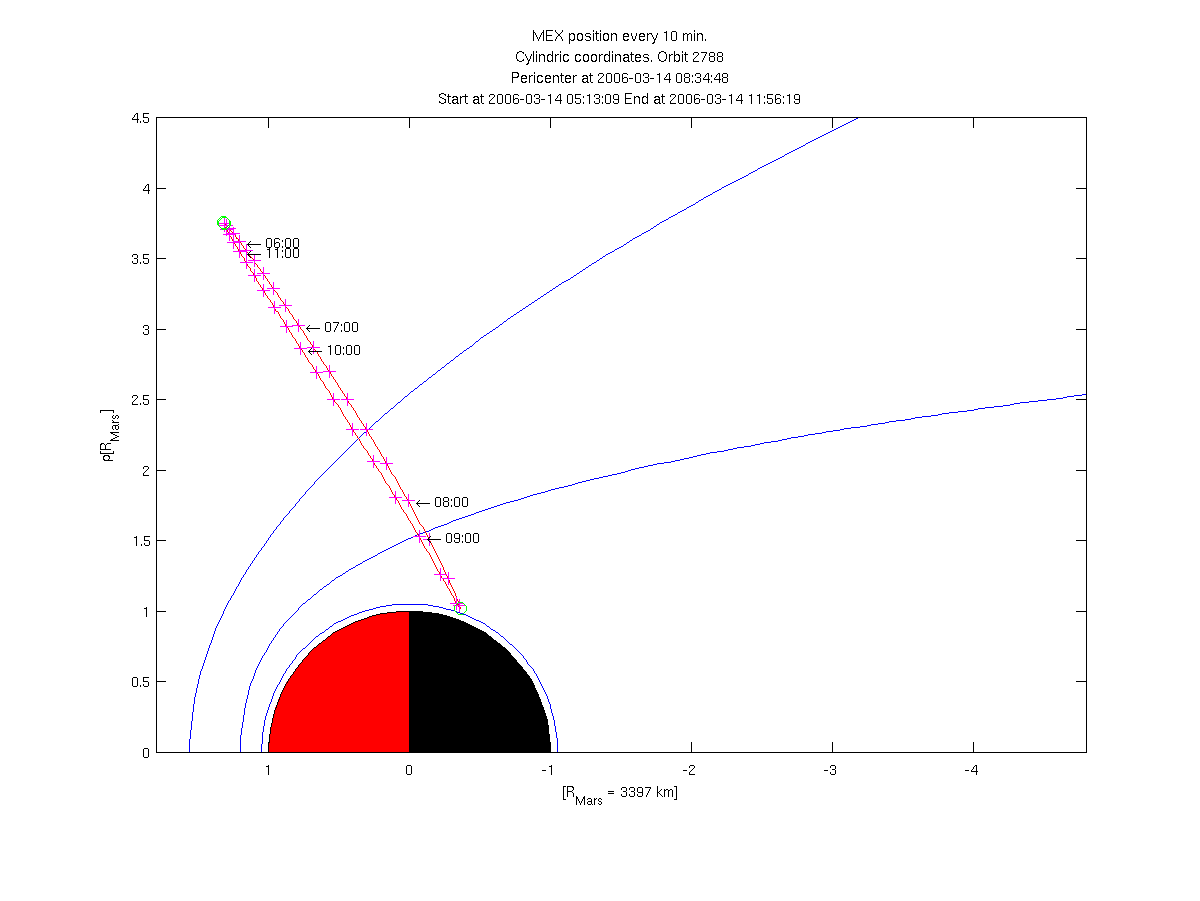
| 2788 | 073 | 2006-03-14 08:34:47 | _ | |||||
| 2788 | 073 | 2006-03-14 08:34:47 | _ | |||||
| 2788 | 073 | 2006-03-14 08:34:47 | _ | |||||
| 2788 | 073 | 2006-03-14 08:34:47 | _ | |||||
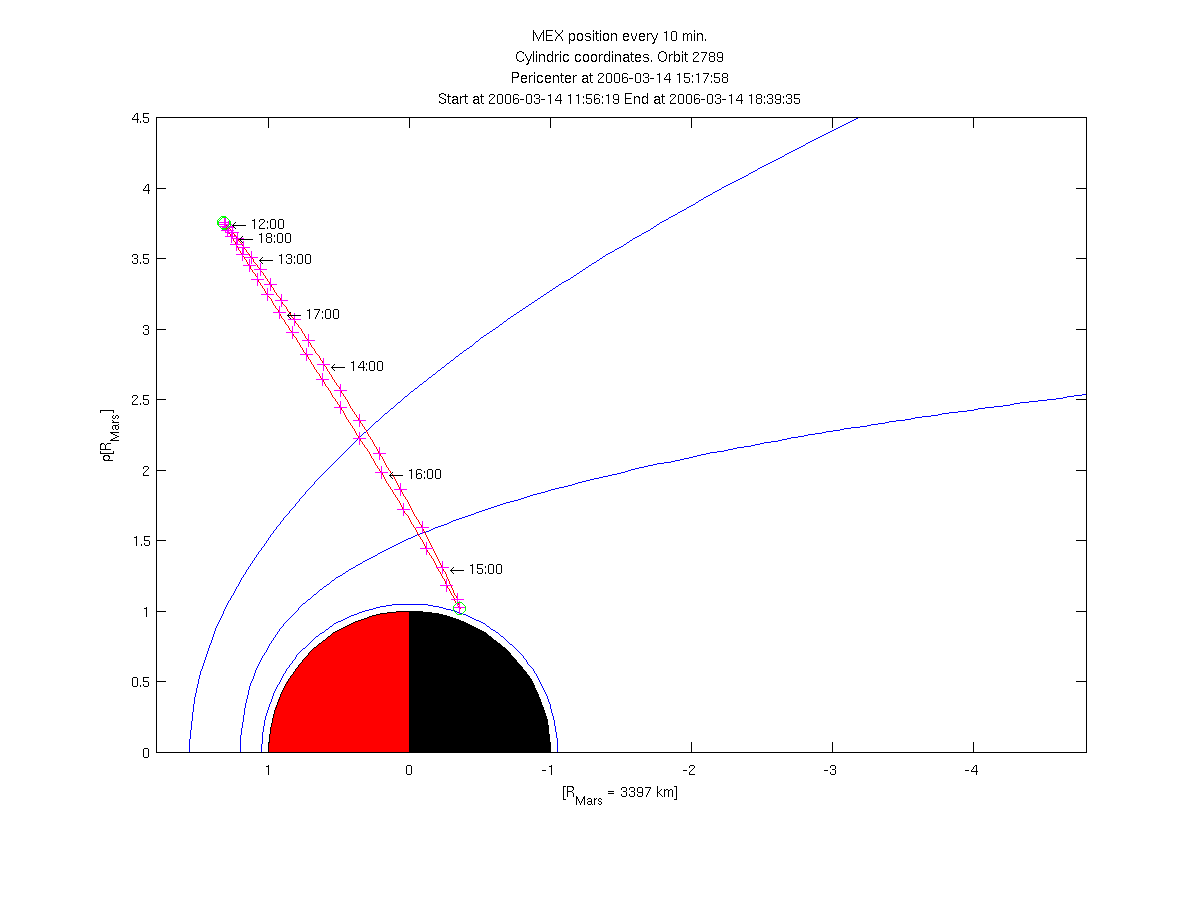
| 2789 | 073 | 2006-03-14 15:17:58 | _ | |||||
| 2789 | 073 | 2006-03-14 15:17:58 | _ | |||||
| 2789 | 073 | 2006-03-14 15:17:58 | _ | |||||
| 2790 | 073 | 2006-03-14 22:01:16 | _ | |||||
| 2790 | 073 | 2006-03-14 22:01:16 | _ | |||||
| 2790 | 073 | 2006-03-14 22:01:16 | _ | |||||
| 2790 | 073 | 2006-03-14 22:01:16 | _ | |||||
| 2791 | 074 | 2006-03-15 04:44:29 | _ |